
Article
Line Scope: Using the Line Intensity Plot to Set Up a Line Scan Camera
If you have used an oscilloscope, Line Scope will feel familiar right away. Instead of an image, this display draws a line intensity plot: the horizontal axis is the pixel number along the sensor, and the vertical axis is that pixel's brightness. For a color camera you see three curves: red, green and blue.
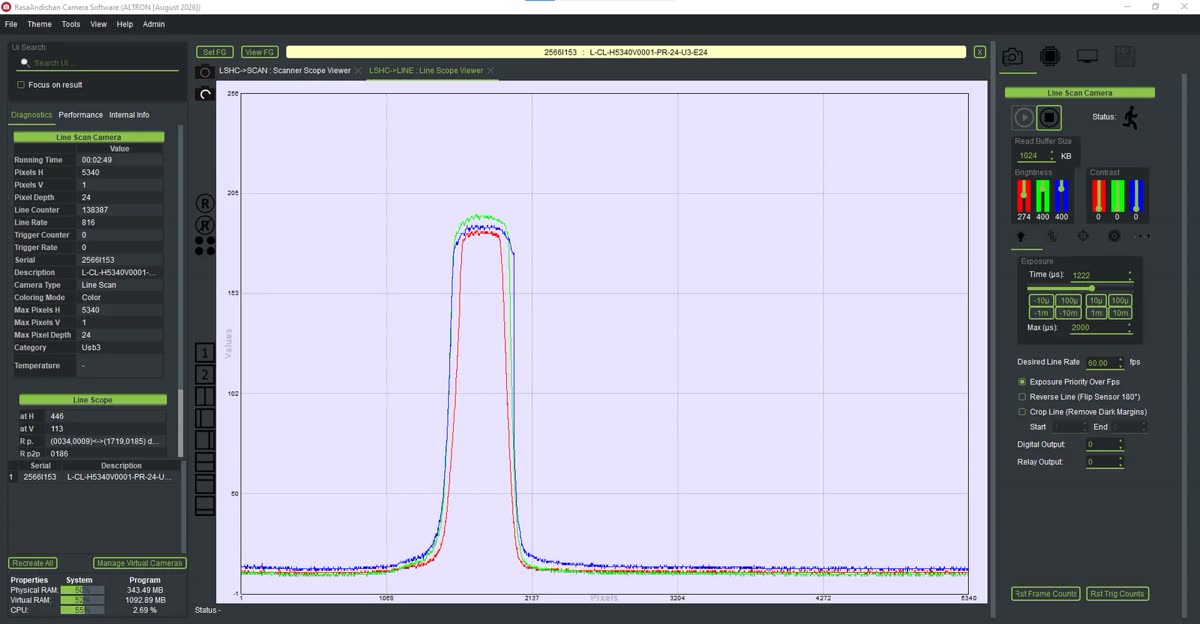
Why do you need it? Because a line scan camera does not produce an image; it produces lines. The image you see in Scanner Scope is built by stacking thousands of lines, and it can fool the eye. On the image it is hard to tell where the line is saturated or which side is short of light. On the plot you see it at a glance.
This display is specific to line scan cameras and has two controls in its settings panel:
You can zoom into part of the plot with the mouse. The zoom stays in place until you double-click.
When you set exposure, keep Auto Scale to Content off. With a fixed scale, the plot means the same thing at every moment, and you can compare levels. With auto scale on, even a dim line fills the full height of the display, and you may think there is enough light.
Auto scale is useful when you want to see small variations in a weak signal.
- Place a bright, uniform surface, such as a sheet of white paper, under the scan line.
- Open Line Scope and turn off Auto Scale to Content.
- Change the exposure time in the camera panel until the peaks stay below the top of the plot but do not drop below half its height.
- If part of the curve is flat and pressed against the top, that part is saturated. Reduce the exposure.
A line scan camera sees only a narrow strip of the scene. If that strip does not fall exactly on the light stripe, or the camera is mounted at an angle to the direction of travel, part of the line gets less light. In the image this shows up only as a vague shadow. On Line Scope, you see a clear slope.
The method we use during installation is simple. Hold the same uniform white surface under the camera and watch the plot in live mode. Then adjust the angle of the camera or the light little by little until the curve is as flat as possible across the working width.
- If only one side of the plot drops off, the problem is most likely the alignment of the camera with the light line or the mounting angle.
- If both edges drop off by the same amount and the middle is higher, that is normal lens behavior, called vignetting. You correct it later with the lens shading correction plug-in, not by moving the camera.
When Line Scope is in the graph, a table for it also appears in the Diagnostics tab:
The plot has one more use. In the line scan camera panel, the Crop Line option keeps only the pixels from Start to End and removes the dark margins. Read these two pixel numbers from the horizontal axis of this plot: zoom into the bright area and note where it starts and ends.
Many people judge saturation while auto scale is on. In that mode every curve stretches to the top of the display, and the flat peak of saturation gets mistaken for an ordinary peak.
To learn about RasaAndishan line scan cameras, see the related page.
To learn more about line scan cameras, also see the Wikipedia article (English).
If the Line Scope curve behaves strangely in your installation and you cannot find the reason, send us a screenshot of it through contact page.