
Article
ALTRON at a glance: one program for all your cameras
If you have a line scan camera, an area scan camera and maybe a thermal camera on the same production floor, you have probably wondered: do I need to learn a separate program for each one? Our answer is ALTRON software. It is the same software we deliver with every camera. With it you connect the camera, view its image, process it and save it. All in one window.
Each post in this series looks at one ALTRON feature on its own. But before the details, it helps to understand the logic of the program itself. The rest of the series builds on this foundation.
ALTRON is not a closed program with a few fixed menus. The image passes through a path we call a data flow graph, or flow graph. Each station on this path is a node. Each node is a plug-in that does one specific job.
A real example is the ready-made graph for the color line-scan camera: camera, black level correction (BLC), flat field correction (Flat Field), spatial correction, white balance and gamma. At the end of the path are the image viewer, the line plot and TIFF saving. The color area-scan camera graph has other nodes, for example debayer, which builds color from the sensor's Bayer pattern.
If you remove a node, that step is not performed. If you swap two nodes, the result changes too. Each graph is saved in a file with the .dfg extension. It is this flexibility that makes one program usable for very different tasks: industrial inspection, thermal imaging, spectroscopy and photo finish.
Every node in the graph belongs to one of these five families. Know these five and you know the structure of the whole software:
Next to each plugin's name is one of three labels: ASC, LSC or ASC/LSC. ASC means only for area scan cameras, which capture a full frame each time. LSC means it is only for line scan cameras, which capture one row of pixels each time, with the object's motion building the second dimension of the image. ASC/LSC means both.
For example, BLC is labeled LSC and debayer is labeled ASC. So before adding any node, know which type your camera is.
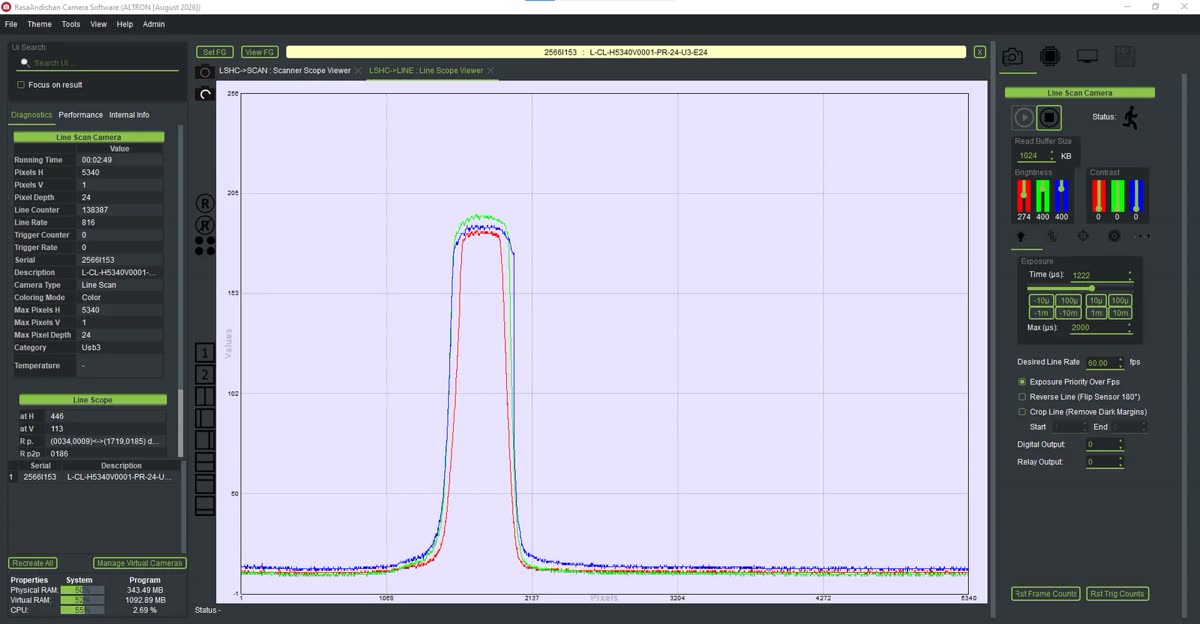
A tip for the first days: instead of browsing through the tabs, type the setting's name in Ui Search, for example Exposure or Gamma. If the Focus on result option is on, the cursor goes straight to that control and you can change its value right away.
The graph editor opens via Tools › Flow Graph Editor. In this editor, the color of each box shows which family the node belongs to.
A mistake we see often is that the graph is edited and saved, but the change does not take effect. The reason is simple: after saving, you must click the Recreate All button in the main window so that each camera's chain is rebuilt from scratch.
In the next parts we'll go through these one by one, with practical details. You can also find a general introduction to the software in ALTRON page page.
You can find a more general explanation of machine vision on Wikipedia (English).
If you want to know how ALTRON fits your camera or production line, send us your question through the contact page.