
Article
Your first image in ALTRON with each camera's ready-made graphs
You've taken the camera out of the box, connected the cable and opened ALTRON. What's next? You don't need to build the processing path from scratch. For each camera type, ALTRON has ready-made graphs and loads the most suitable one itself when it detects the camera.
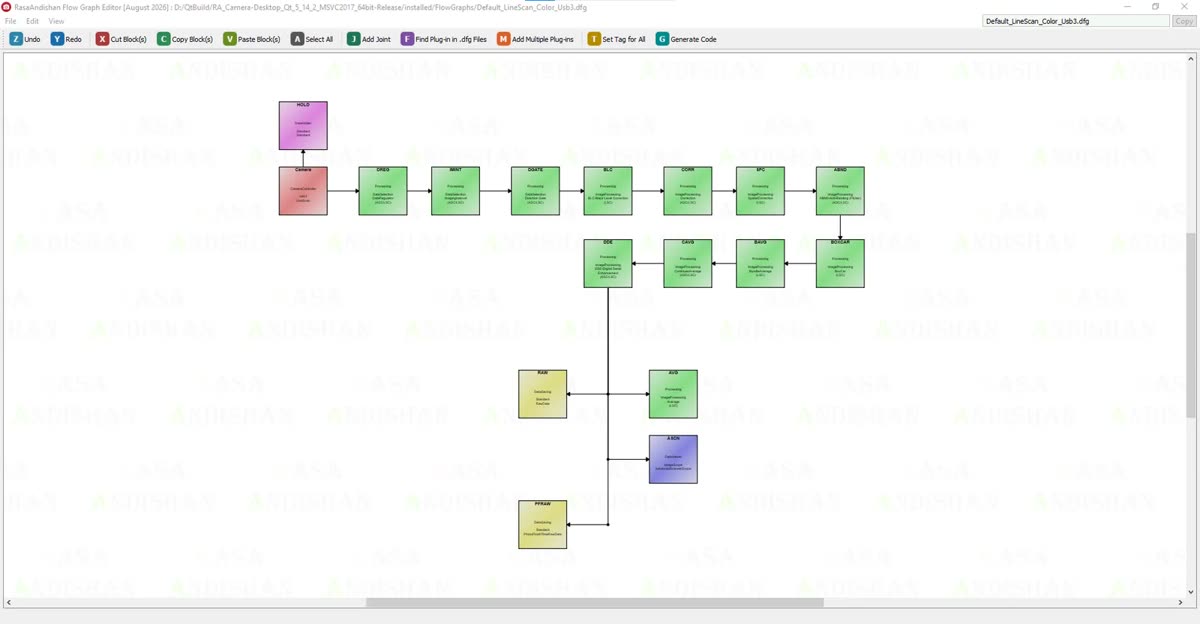
This article is about those first few minutes: from plugging in the cable to seeing the first image, and what to do if the graph doesn't fit.
- Connect the camera. ALTRON updates the camera list by itself. A few moments later, the camera appears in the Connected Cameras list with its serial number and model description.
- ALTRON loads the right graph and builds the chain of nodes. The camera settings panel opens in the right column.
- Press the Start button in the camera panel. Until you press it, no data flows through the graph and the viewers stay empty.
- If you see the running-man icon next to Status in the camera panel, data is flowing. To be extra sure, check in the Diagnostics tab of the left column whether Line Counter (on a line-scan camera) or Frame Counter (on an area-scan camera) is increasing.
- Go to the viewer tabs in the central area. Each tab title shows the node name and the viewer type. For example, in the color line-scan camera graph you will see a Scanner Scope tab and a Line Scope Viewer tab.
- If the image is very dark or completely white, go to the exposure time. That is the topic of our next post.
The default graphs are in the FlowGraphs folder next to the program's executable. Each file's name tells you which camera it is for:
- Camera type: AreaScan for area-scan or LineScan for line-scan.
- Pixel format: Color for color, BW for 8-bit monochrome and BW16 for 16-bit monochrome
- Interface: Usb2, Usb3, GenICam or Virtual for a virtual camera
For example, Default_LineScan_Color_Usb3.dfg is the graph for a color line-scan camera with a USB 3.0 interface. There are also a few special graphs alongside these. One replays raw data you have recorded. Another is a version of the color area-scan graph whose save branch saves at time intervals.
ALTRON puts these files in the folder every time it runs, but it doesn't overwrite a file you have edited. If a file has been deleted, it is created again.
Each camera keeps its own settings by serial number, including the graph it was used with. So ALTRON first goes to that graph. If that graph is missing or does not work, it takes the default graph for that camera type.
Before using it, ALTRON also checks that the graph matches the camera. Four things are compared: camera type (line-scan or area-scan), interface (USB2, USB3 or GenICam), pixel format, and whether the camera is real or virtual. A graph that does not match is set aside and a suitable graph is loaded.
In this case you will see the message The flow graph set for this camera was not used - it does not match the camera. Don't worry, the camera works. This message only says that the previous graph was not used. You can also see the reason in the message details.
Sometimes the graph file is corrupted or a node in it no longer exists. If the default graph on disk is corrupted, ALTRON replaces it with the intact copy it keeps inside the program itself and tries again. If that still fails, it shows the message This camera was not started: no flow graph could be loaded for it with these options:
The default graph is a starting point, not the final version. Our recommended approach is:
- Open the graph in Flow Graph Editor.
- Use Save as to save a copy under a new name and work only on that copy.
- Each time you save it, press Recreate All in the main window to apply the change.
This way you always have an untouched version for comparison. To get to know the software itself better, ALTRON page.
If you want to read more about the theory behind dataflow programming, this Wikipedia article (English) is a good start.
If your camera does not appear in the list or you have a problem with its graph, turn to contact us here and we'll look into it together.