
Article
Branching in the ALTRON graph: saving, averaging and displaying at the same time
Say you have a sample under the camera in the lab for several hours. You want to see a smooth, low-noise image on the monitor, save all the raw data for later analysis, and separately take a snapshot every few seconds for a report. That is three demands on one camera. In ALTRON, you do this by branching the graph.
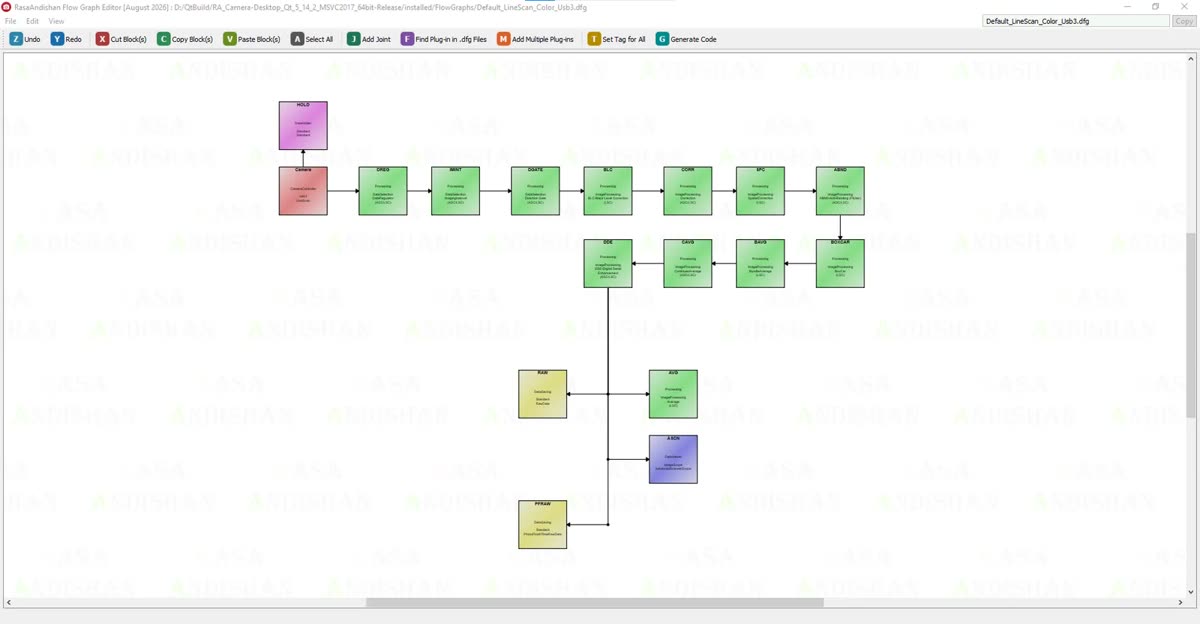
What does branching mean?
Every ALTRON graph is made of nodes connected by wires. The camera is at the head of the chain. Processing comes next, and storage and display nodes come at the end. A node's output doesn't have to go to just one node. You can draw several wires from one node's output, and each wire creates a separate branch.
Branching does not copy the data; it only shares it. So adding a display or saving branch costs no extra memory.
This is the most important decision. Each branch receives exactly the data that flows at the branch point. A few simple rules:
- Split off the branch that saves data for analysis after the physical sensor corrections, such as black level and dark and white correction. But this branch must come before cosmetic changes such as gamma.
- Put smoothing and sharpening that are only for the eye in the display branch, so the saved data stays untouched.
- If your own program needs to take data from the middle of the path, connect a Data Holder node at that point. This node doesn't change the data; it just keeps a copy for external code.
Build this structure in Tools › Flow Graph Editor:
- Place the camera first, then the basic corrections, for example dark and white correction with the Correction node.
- From the output of the last correction, run the first wire to a raw data saving node. This branch saves everything in full.
- Run the second wire to a Smoothing node with the Continuous Average stage, and feed its output to a display. This branch shows the smooth, averaged image.
- Connect the third wire directly to another display so you can also see the live, unaveraged data.
- Save the graph and press Recreate All in the main program. The change does not take effect until the chain is rebuilt.
For periodic snapshots, put an ImagingInterval node at the start of the branch and connect the saving node after it. It has three modes:
Be sure to check the Apply to saving too option. If it is ticked, the saving nodes after this node record only the samples that pass, and you get a time-lapse recording. If it is not ticked, the thinning only lightens the processing and display after the node, and saving nodes ignore its output. In that case, while a saving node on the same camera is recording, the node passes all data through so nothing is lost from the recording.
Among ALTRON's default graphs there is also a ready-made example called Default_AreaScan_Color_Usb3+ImagingIntervalForDataSaving that you can start from.
- Putting gamma or sharpening before the saving branch point, then wondering why the saved data doesn't match the measurements.
- Forgetting Recreate All after changing the graph.
- A heavy display branch that slows down the whole chain. Check the Performance tab to see which node takes the largest share of the CPU, and put an ImagingInterval in Max rate mode in front of it.
Before a long recording, run the graph for a few minutes and compare the input and output data rates of each node in the Internal Info tab. If a node's output is suddenly lower than its input and you didn't intend that, data is being dropped in exactly that node.
For a more general explanation of processing pipelines, see Wikipedia (English).
We have collected common questions about graphs and recording in our FAQ. If your graph needs a special structure, write to us via contact page and we'll design it together.